[2' read]
Multi-Agent Orchestration for Data Analysis & Simulation Scenarios
Agents

A sophisticated data analysis and simulation platform using a multi-agent workflow powered by Chainlit and Mistral AI. This application enables users to perform complex data queries and run what-if scenario simulations through natural language interactions.
Current Status#
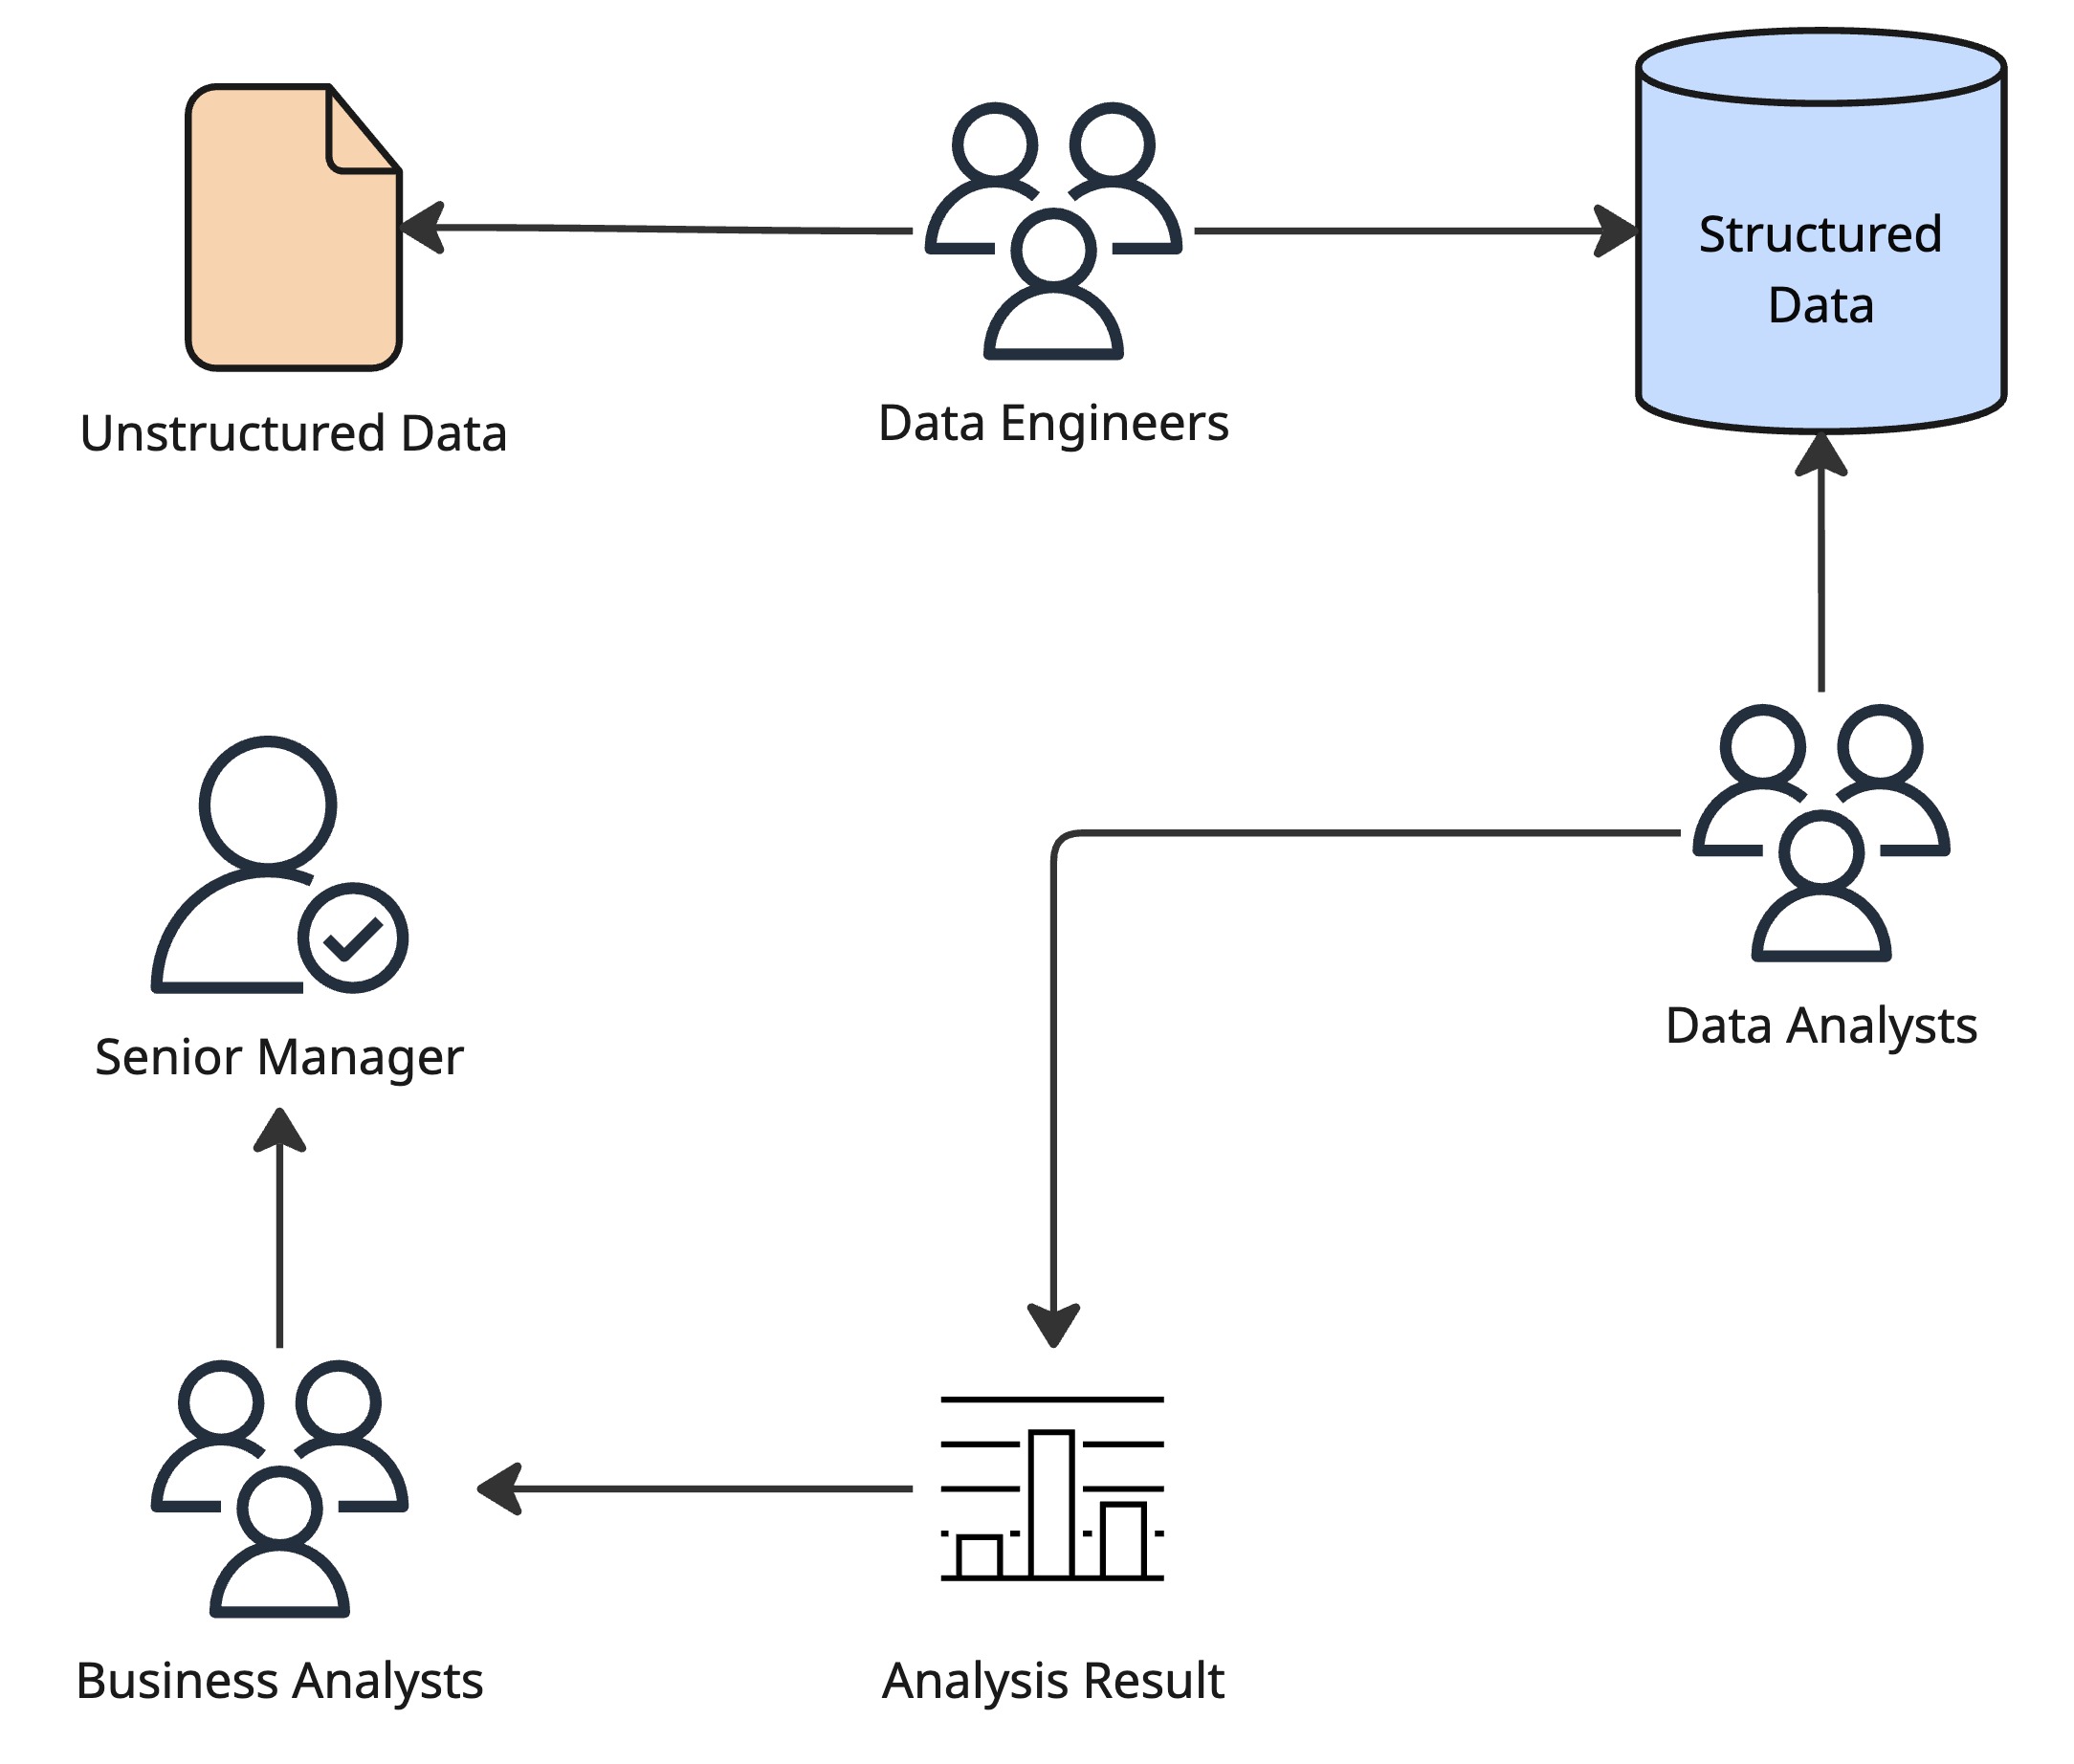
Desired Status#
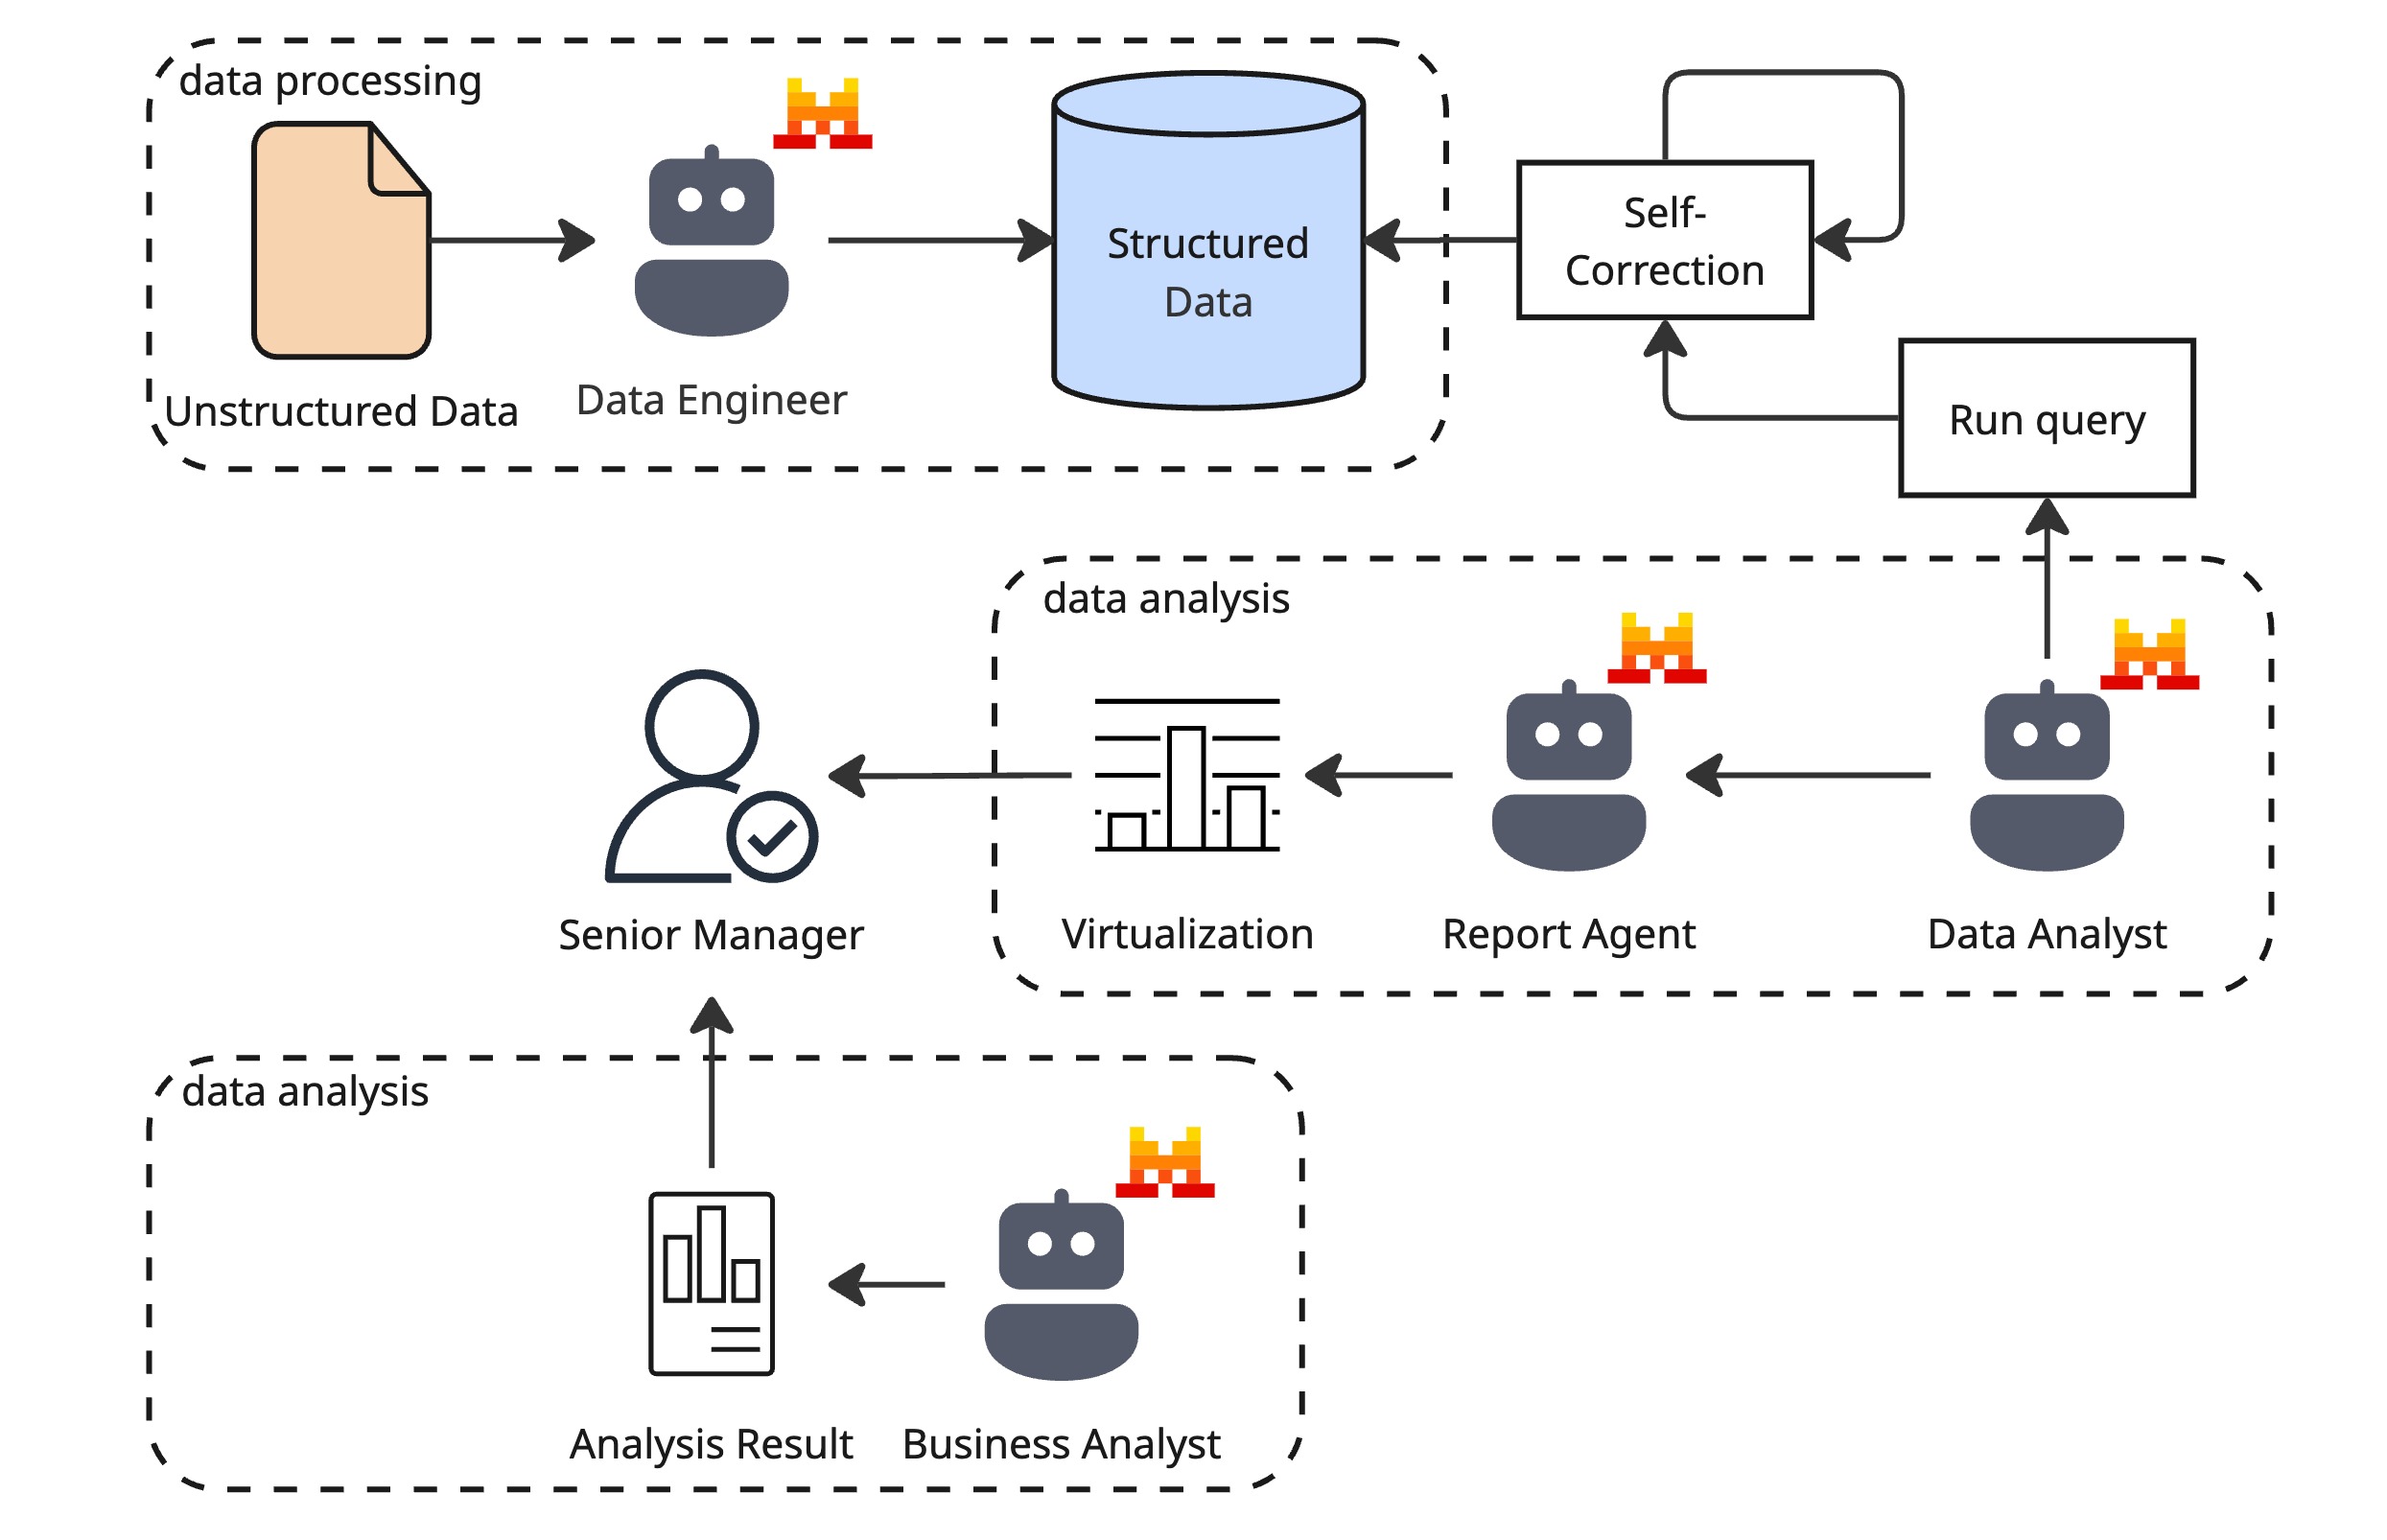
🚀 Features#
- Natural Language Querying: Ask data questions in plain English
- Automatic SQL Generation: AI converts questions to SQL queries
- Scenario Simulation: Run what-if analyses on your data
- Visualization: Automatic chart generation for results
- Multi-Agent Architecture: Specialized agents for different tasks
- Interactive UI: User-friendly Chainlit interface
📋 Table of Contents#
🛠️ Installation#
Prerequisites#
- Python 3.11+
- UV for package management (recommended)
- Mistral API key
Steps#
-
Clone the repository:
-
Set up environment variables:
- Copy
.env.exampleto.env - Add your Mistral API key to
.env
- Copy
-
Create and activate virtual environment:
uv venv source .venv/bin/activate # Linux/macOS # .\.venv\Scripts\activate # Windows -
Install dependencies:
uv sync -
Run the application:
uv run -- chainlit run app.py
🎛️ Usage#
Starting the Application#
- Run the Chainlit app as shown above
- Open the provided URL in your browser
- Use the starter questions or ask your own
Example Queries#
- "Show total estimated revenue across all accounts in January 2025"
- "List the top 5 account names by available balance"

- "What if we raise deposit rates by 0.5%?"
Workflow Visualization#
Type "Show workflow" to see the system architecture diagram.
📊 Demos#
Data Analysis#
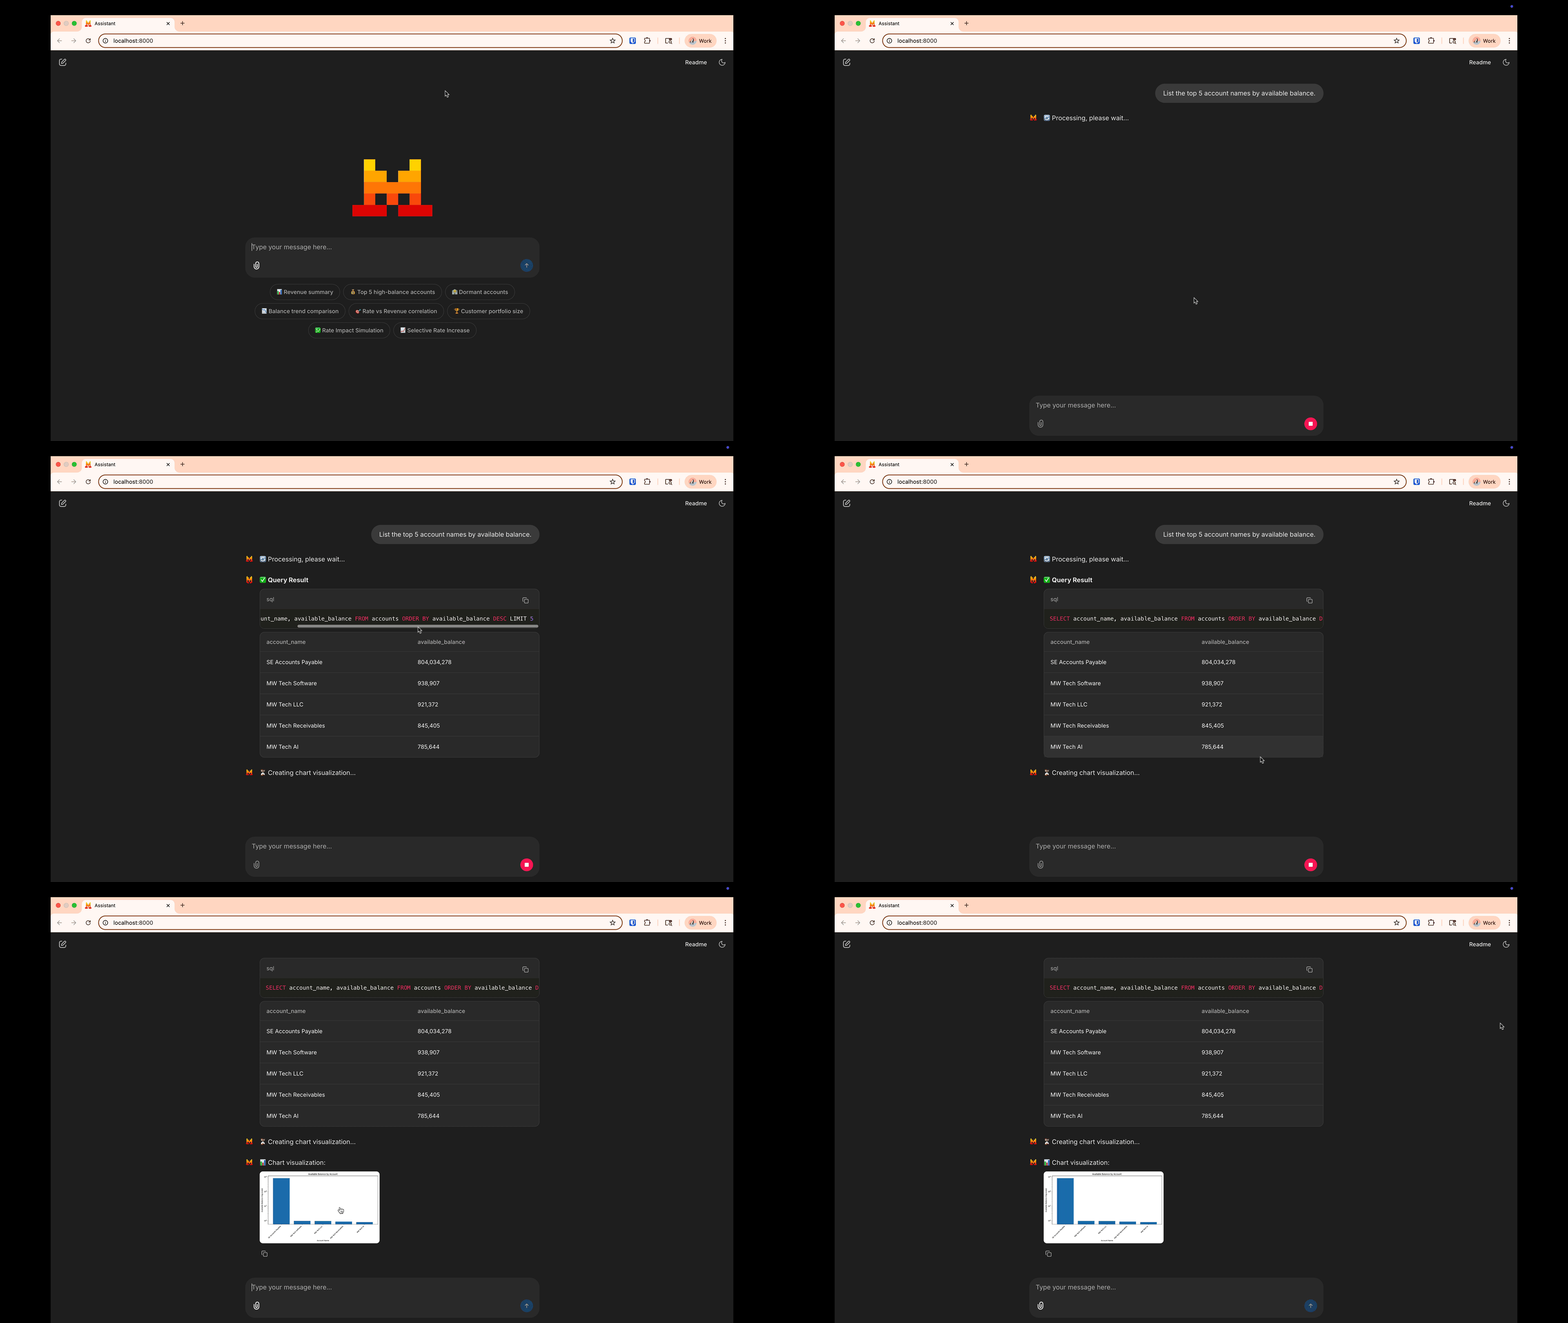
Scenario Simulation#
🏛️ Architecture#
The system uses a multi-agent approach:
- Router Agent: Determines query intent
- Analysis Agent: Handles data queries
- Simulation Agent: Runs what-if scenarios
- Report Agent: Generates visualizations
graph TD;
    A[User] --> B[Router Agent];
    B -->|Data Query| C[Analysis Agent];
    B -->|Simulation| D[Simulation Agent];
    C --> E[Database];
    D --> E;
    C --> F[Report Agent];
    D --> F;
F --> A;🗺️ Roadmap#
- Add voice input support
- Implement more advanced simulation models
- Add user authentication
- Support additional data sources