This AI data analyst can plot a linear regression chart based on CSV data. It uses Mistral's Codestral as the LLM, and the Code Interpreter SDK by E2B for the code interpreting capabilities. The SDK quickly creates a secure cloud sandbox powered by Firecracker. Inside this sandbox is a running Jupyter server that the LLM can use.
Read more about Mistral's new Codestral model here.
The AI agent performs a data analysis task on an uploaded CSV file, executes the AI-generated code in the sandboxed environment by E2B, and returns a chart, saving it as a PNG file.
Installation
1. Install dependencies
Ensure all dependencies are installed:
npm install2. Set up environment variables
Create a .env file in the project root directory and add your API keys:
- Copy
.env.templateto.env - Get the E2B API KEY
- Get the MISTRAL API KEY
3. Run the program
npm run startThe script performs the following steps:
- Loads the API keys from the environment variables.
- Uploads the CSV dataset to the E2B sandboxed cloud environment.
- Sends a prompt to the Codestal model to generate Python code for analyzing the dataset.
- Executes the generated Python code using the E2B Code Interpreter SDK.
- Saves any generated visualization as a PNG file.
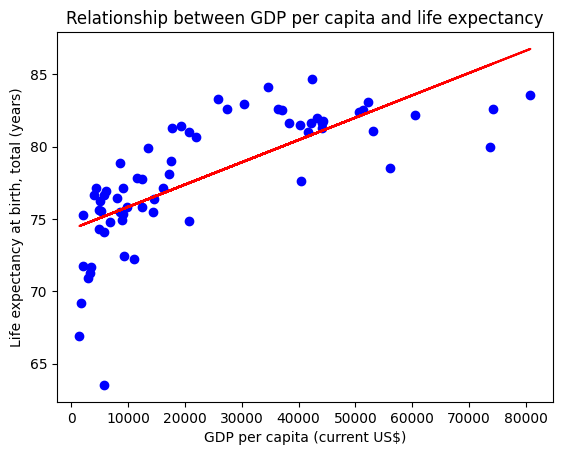
After running the program, you should get the result of the data analysis task saved in an image_1.png file. You should see a plot like this:
Connect with E2B & learn more
If you encounter any problems, please let us know at our Discord.
Check the E2B documentation to learn more about how to use the Code Interpreter SDK.